

| City | Reading |
|---|---|
| Amsterdam | Nederland |
| Apeldoorn | Nederland |
| Barcelona | Spanje |
| Berlijn | Duitsland |
| Birmingham | Verenigd Koninkrijk |
| Bordeaux | Frankrijk |
| Den Haag | Nederland |
| Frankfurt | Duitsland |
| Gdańsk | Polen |
| Glasgow | Verenigd Koninkrijk |
| Hamburg | Duitsland |
| Krakau | Polen |
| Leeds | Verenigd Koninkrijk |
| Leipzig | Duitsland |
| Rijsel | Frankrijk |
| Łódź | Polen |
| Londen | Verenigd Koninkrijk |
| Lyon | Frankrijk |
| Madrid | Spanje |
| Manchester | Verenigd Koninkrijk |
| Marseille | Frankrijk |
| Milaan | Italië |
| München | Duitsland |
| Parijs | Frankrijk |
| Rome | Italië |
| Rotterdam | Nederland |
| Sevilla | Spanje |
| Utrecht | Nederland |
| Valladolid | Spanje |
| Warschau | Polen |
| Wrocław | Polen |
| Zaragoza | Spanje |

Compare cities
Are commercial trips moving faster or slower through a city?
32 cities, januari 2025 – augustus 2026 · 7,22 to 7,73 km
32 cities, januari 2025 – augustus 2026 · 9,4 to 11,7%
How much ground does a commercial vehicle cover in a quarter of an hour?
Map
| City | 15-minute reach |
|---|---|
| Amsterdam | 7,44 km |
| Apeldoorn | 9,96 km |
| Barcelona | 7,28 km |
| Berlijn | 6,15 km |
| Birmingham | 7,47 km |
| Bordeaux | 7,57 km |
| Den Haag | 7,68 km |
| Frankfurt | 8,82 km |
| Gdańsk | 7,50 km |
| Glasgow | 8,79 km |
| Hamburg | 8,06 km |
| Krakau | 6,25 km |
| Leeds | 9,53 km |
| Leipzig | 7,42 km |
| Rijsel | 9,52 km |
| Łódź | 7,53 km |
| Londen | 6,77 km |
| Lyon | 8,10 km |
| Madrid | 9,65 km |
| Manchester | 9,36 km |
| Marseille | 7,85 km |
| Milaan | 7,20 km |
| München | 6,86 km |
| Parijs | 7,06 km |
| Rome | 9,00 km |
| Rotterdam | 9,64 km |
| Sevilla | 7,07 km |
| Utrecht | 10,05 km |
| Valladolid | 7,26 km |
| Warschau | 6,82 km |
| Wrocław | 6,89 km |
| Zaragoza | 10,40 km |
Tap a city for details
Table
| Row, and how the city’s place moved since last month | City | Country | 15-minute reach (km) |
|---|---|---|---|
| 1updownno change in place since last monthplaces since last month | Zaragoza |  Spanje | 10,40 km |
| 2updownno change in place since last month1places since last month | Utrecht |  Nederland | 10,05 km |
| 3updownno change in place since last month1places since last month | Apeldoorn | Nederland | 9,96 km |
| 4updownno change in place since last month6places since last month | Madrid | Spanje | 9,65 km |
| 5updownno change in place since last month4places since last month | Rotterdam | Nederland | 9,64 km |
| 6updownno change in place since last month2places since last month | Leeds |  Verenigd Koninkrijk | 9,53 km |
| 7updownno change in place since last month1places since last month | Rijsel |  Frankrijk | 9,52 km |
| 8updownno change in place since last month2places since last month | Manchester | Verenigd Koninkrijk | 9,36 km |
| 9updownno change in place since last month2places since last month | Rome |  Italië | 9,00 km |
| 10updownno change in place since last month3places since last month | Frankfurt |  Duitsland | 8,82 km |
| 11updownno change in place since last month6places since last month | Glasgow | Verenigd Koninkrijk | 8,79 km |
| 12updownno change in place since last month2places since last month | Lyon | Frankrijk | 8,10 km |
| 13updownno change in place since last month1places since last month | Hamburg | Duitsland | 8,06 km |
| 14updownno change in place since last month1places since last month | Marseille | Frankrijk | 7,85 km |
| 15updownno change in place since last month4places since last month | Den Haag | Nederland | 7,68 km |
| 16updownno change in place since last month5places since last month | Bordeaux | Frankrijk | 7,57 km |
| 17updownno change in place since last month1places since last month | Łódź |  Polen | 7,53 km |
| 18updownno change in place since last month5places since last month | Gdańsk | Polen | 7,50 km |
| 19updownno change in place since last month1places since last month | Birmingham | Verenigd Koninkrijk | 7,47 km |
| 20updownno change in place since last month4places since last month | Amsterdam | Nederland | 7,44 km |
| 21updownno change in place since last month4places since last month | Leipzig | Duitsland | 7,42 km |
| 22updownno change in place since last month4places since last month | Barcelona | Spanje | 7,28 km |
| 23updownno change in place since last month1places since last month | Valladolid | Spanje | 7,26 km |
| 24updownno change in place since last month3places since last month | Milaan | Italië | 7,20 km |
| 25updownno change in place since last month2places since last month | Sevilla | Spanje | 7,07 km |
| 26updownno change in place since last month6places since last month | Parijs | Frankrijk | 7,06 km |
| 27updownno change in place since last month3places since last month | Wrocław | Polen | 6,89 km |
| 28updownno change in place since last month2places since last month | München | Duitsland | 6,86 km |
| 29updownno change in place since last month4places since last month | Warschau | Polen | 6,82 km |
| 30updownno change in place since last month2places since last month | Londen | Verenigd Koninkrijk | 6,77 km |
| 31updownno change in place since last month2places since last month | Krakau | Polen | 6,25 km |
| 32updownno change in place since last month1places since last month | Berlijn | Duitsland | 6,15 km |
By country
Over time
| Amsterdam | Barcelona | Leipzig | |
|---|---|---|---|
| Jan | 7,85 | 7,11 | 7,79 |
| Feb | 7,96 | 7,03 | 8 |
| Mar | 7,62 | 6,83 | 7,75 |
| Apr | 7,39 | 6,85 | 7,66 |
| May | 7,29 | 6,69 | 7,55 |
| Jun | 7,37 | 6,7 | 7,59 |
| Jul | 7,1 | 6,67 | 7,75 |
| Aug | 7,28 | 7,61 | 7,5 |
| Sep | 7,18 | 6,62 | 7,58 |
| Oct | 7,48 | 6,46 | 7,62 |
| Nov | 7,38 | 6,59 | 7,54 |
| Dec | 7,46 | 6,64 | 7,54 |
| Jan | 7,5 | 6,67 | 7,36 |
| Feb | 7,52 | 6,39 | 7,3 |
| Mar | 7,34 | 6,53 | 7,27 |
| Apr | 7,34 | 6,55 | 7,3 |
| May | 7,4 | 6,46 | 7,29 |
| Jun | 7,5 | 6,41 | 7,44 |
| Jul | 7,56 | 6,58 | 7,51 |
| Aug | 7,44 | 7,28 | 7,42 |
When a vehicle is out working, how much time is spent stationary with the engine running?
Map
| City | Idling intensity |
|---|---|
| Amsterdam | 10,9% |
| Apeldoorn | 6,6% |
| Barcelona | 12,0% |
| Berlijn | 14,3% |
| Birmingham | 9,4% |
| Bordeaux | 8,9% |
| Den Haag | 9,9% |
| Frankfurt | 10,2% |
| Gdańsk | 8,2% |
| Glasgow | 8,9% |
| Hamburg | 10,7% |
| Krakau | 10,7% |
| Leeds | 7,6% |
| Leipzig | 12,8% |
| Rijsel | 9,4% |
| Łódź | 12,6% |
| Londen | 12,8% |
| Lyon | 9,4% |
| Madrid | 7,2% |
| Manchester | 8,6% |
| Marseille | 9,4% |
| Milaan | 17,7% |
| München | 14,4% |
| Parijs | 14,3% |
| Rome | 6,5% |
| Rotterdam | 7,6% |
| Sevilla | 9,2% |
| Utrecht | 8,1% |
| Valladolid | 9,4% |
| Warschau | 11,8% |
| Wrocław | 10,7% |
| Zaragoza | 6,3% |
Tap a city for details
Table
| Row, and how the city’s place moved since last month | City | Country | Idling intensity (%) |
|---|---|---|---|
| 1updownno change in place since last monthplaces since last month | Zaragoza | Spanje | 6,3% |
| 2updownno change in place since last month4places since last month | Rome | Italië | 6,5% |
| 3updownno change in place since last month1places since last month | Apeldoorn | Nederland | 6,6% |
| 4updownno change in place since last month1places since last month | Madrid | Spanje | 7,2% |
| 5updownno change in place since last month2places since last month | Leeds | Verenigd Koninkrijk | 7,6% |
| 6updownno change in place since last month3places since last month | Rotterdam | Nederland | 7,6% |
| 7updownno change in place since last month1places since last month | Utrecht | Nederland | 8,1% |
| 8updownno change in place since last month4places since last month | Gdańsk | Polen | 8,2% |
| 9updownno change in place since last month1places since last month | Manchester | Verenigd Koninkrijk | 8,6% |
| 10updownno change in place since last month2places since last month | Bordeaux | Frankrijk | 8,9% |
| 11updownno change in place since last month4places since last month | Glasgow | Verenigd Koninkrijk | 8,9% |
| 12updownno change in place since last month3places since last month | Sevilla | Spanje | 9,2% |
| 13updownno change in place since last monthplaces since last month | Marseille | Frankrijk | 9,4% |
| 14updownno change in place since last month2places since last month | Birmingham | Verenigd Koninkrijk | 9,4% |
| 15updownno change in place since last month1places since last month | Valladolid | Spanje | 9,4% |
| 16updownno change in place since last month1places since last month | Rijsel | Frankrijk | 9,4% |
| 17updownno change in place since last month1places since last month | Lyon | Frankrijk | 9,4% |
| 18updownno change in place since last month3places since last month | Den Haag | Nederland | 9,9% |
| 19updownno change in place since last month8places since last month | Frankfurt | Duitsland | 10,2% |
| 20updownno change in place since last month3places since last month | Hamburg | Duitsland | 10,7% |
| 21updownno change in place since last month1places since last month | Wrocław | Polen | 10,7% |
| 22updownno change in place since last monthplaces since last month | Krakau | Polen | 10,7% |
| 23updownno change in place since last month4places since last month | Amsterdam | Nederland | 10,9% |
| 24updownno change in place since last monthplaces since last month | Warschau | Polen | 11,8% |
| 25updownno change in place since last month2places since last month | Barcelona | Spanje | 12,0% |
| 26updownno change in place since last month1places since last month | Łódź | Polen | 12,6% |
| 27updownno change in place since last month1places since last month | Leipzig | Duitsland | 12,8% |
| 28updownno change in place since last monthplaces since last month | Londen | Verenigd Koninkrijk | 12,8% |
| 29updownno change in place since last monthplaces since last month | Berlijn | Duitsland | 14,3% |
| 30updownno change in place since last monthplaces since last month | Parijs | Frankrijk | 14,3% |
| 31updownno change in place since last monthplaces since last month | München | Duitsland | 14,4% |
| 32updownno change in place since last monthplaces since last month | Milaan | Italië | 17,7% |
By country
Over time
| Amsterdam | Barcelona | Leipzig | |
|---|---|---|---|
| Jan | 11,3 | 13,7 | 12,1 |
| Feb | 11,3 | 14 | 11,6 |
| Mar | 11,5 | 14 | 12,5 |
| Apr | 11,5 | 14,2 | 13 |
| May | 11,6 | 14,3 | 13 |
| Jun | 11,4 | 14,3 | 12,8 |
| Jul | 11,9 | 13,9 | 11,8 |
| Aug | 11,3 | 11,6 | 12,7 |
| Sep | 11,9 | 14 | 12,7 |
| Oct | 11,1 | 14 | 12,6 |
| Nov | 11,3 | 13,8 | 12,8 |
| Dec | 11,1 | 14,2 | 12,2 |
| Jan | 10,8 | 13,8 | 12,4 |
| Feb | 10,7 | 14,3 | 12,3 |
| Mar | 11,2 | 13,8 | 12,8 |
| Apr | 11,2 | 13,9 | 12,9 |
| May | 11,1 | 14,2 | 12,7 |
| Jun | 11 | 14,2 | 12,8 |
| Jul | 10,5 | 13,6 | 12,5 |
| Aug | 10,9 | 12 | 12,8 |
How are we sure this data is accurate, relevant and meaningful?
When we aggregate and analyse the data we take four key steps:
Bucketed by origin and destination area, distance band, traffic regime and vehicle type. This grouping turns tens of thousands of trips into a manageable set of city archetypes.

A family must appear consistently across working days and carry enough daily trip volume to be statistically meaningful.
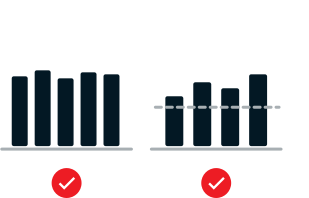
Checks run against a fixed reference period, and the panel stays constant for every month scored afterwards. It is the same panel our mobility index has relied on since the start.
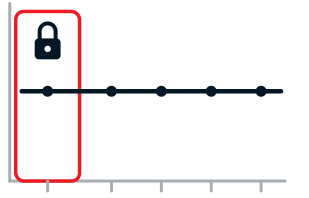
All published figures, the new metric included, are calculated from this one quality-checked set of routes.
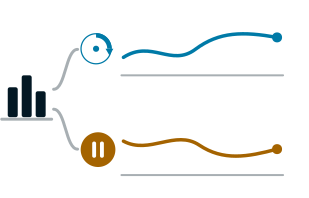
Data-rich cities
Present on 80%+ of working days, 10+ trips per day
Smaller cities
A more lenient bar, still statistically defensible
A one-off trip or a blip in the raw feed cannot swing the number.
Month-to-month movement reflects a real shift in traffic, not a change in what was measured.
The two measures
How much ground does a commercial vehicle cover in a quarter of an hour?
When a vehicle is out working, how much time is spent stationary with the engine running?
Please choose a countryPlease choose a city









Laden
Questions and answers
What exactly is the Commercial Trip Monitor?
0
What exactly is the Commercial Trip Monitor?
0A free, regularly updated hub that shows fleet managers, business owners and city planners exactly how easy or hard it is for vans and trucks to get their work done in 32 of the most economically important cities in Europe — built entirely from real-world Webfleet fleet data.
Why did Webfleet build this?
0
Why did Webfleet build this?
0Because commercial vehicles experience a city differently to commuters: different routes, different restrictions, multiple stops, loading and unloading. Every fleet manager and driver has an opinion on whether their area is getting faster or slower — this gives them, city planners, and journalists the evidence to back it up.
What does it actually measure?
0
What does it actually measure?
0Two key things, for every city: 15-minute reach — how far a typical van or truck travels in a fixed 15 minutes on the road — and idling intensity — how much of a typical journey is spent stationary. Together they show whether a city is becoming more or less productive to operate a fleet in.
How many cities and countries does it cover?
0
How many cities and countries does it cover?
032 of the most economically important cities in Europe, across seven countries.
How often is it updated?
0
How often is it updated?
0Every month.
Is it free? Who is it for?
0
Is it free? Who is it for?
0Yes, free to use. It’s built for fleet operators, who can benchmark their city against every other major European market; city planners, who get an independent, ongoing read on the impact of policy; and journalists covering cities, logistics or sustainability, who get a fresh, credible number to back up or build a story.
Where does the data come from?
0
Where does the data come from?
0In-vehicle telematics from working commercial fleets already using Webfleet — vans and trucks doing business across Europe.
How do you turn raw trip data into a trustworthy monthly figure?
0
How do you turn raw trip data into a trustworthy monthly figure?
0Trips are grouped into route families — bucketed by origin and destination, distance, traffic pattern and vehicle type — turning tens of thousands of individual trips into a manageable set of city archetypes. Each family must then pass two checks: it needs to appear consistently across working days and carry enough daily trip volume to be statistically meaningful.
Does this include only journeys that begin and end within the city?
0
Does this include only journeys that begin and end within the city?
0No: it includes both journeys that begin and end within a city (we call these within-city trips) and trips that begin outside and enter a city (we call these inbound trips).
Does a single unusual trip, or a quiet week, throw the numbers off?
0
Does a single unusual trip, or a quiet week, throw the numbers off?
0No. The panel of qualifying routes is fixed against a reference period and then held constant for every month scored within a delivery. A one-off trip or a blip in the raw feed can’t swing the number — a change from one month to the next reflects a real shift in traffic, not a change in what was being measured.
How do you handle smaller cities with less data?
0
How do you handle smaller cities with less data?
0They’re held to a more lenient statistical bar than data-rich cities (which need 80 %+ working-day presence and 10+ trips per day), but that bar is still statistically defensible — designed so smaller cities can be included without publishing noise as if it were signal.
Is this comparable to existing traffic congestion indices (e.g. TomTom, INRIX)?
0
Is this comparable to existing traffic congestion indices (e.g. TomTom, INRIX)?
0No, and that’s deliberate. Those measure general or consumer traffic. The Commercial Trip Monitor is built purely from fleet vans and trucks, and only analyses trips on routes repeatedly driven by commercial vehicles — so it reflects what fleet operators actually experience, which can move differently to overall congestion. An index showing congestion easing doesn’t necessarily mean conditions are improving for a business operating there.
Data explorer
| Countries | jan 25 | feb 25 | mrt 25 | apr 25 | mei 25 | jun 25 | jul 25 | aug 25 | sep 25 | okt 25 | nov 25 | dec 25 | jan 26 | feb 26 | mrt 26 | apr 26 | mei 26 | jun 26 | jul 26 | aug 26 |
|---|---|---|---|---|---|---|---|---|---|---|---|---|---|---|---|---|---|---|---|---|
| Verenigd Koninkrijk | 7,07 | 7,11 | 7,10 | 7,23 | 7,11 | 7,10 | 7,16 | 7,47 | 6,95 | 7,05 | 6,90 | 7,05 | 7,16 | 7,16 | 7,18 | 7,26 | 7,21 | 7,10 | 7,25 | 7,53 |
| Duitsland | 7,39 | 7,43 | 7,25 | 7,09 | 7,09 | 7,04 | 7,08 | 7,40 | 7,01 | 6,97 | 6,85 | 6,99 | 6,96 | 7,04 | 7,08 | 7,05 | 6,96 | 6,94 | 7,09 | 7,18 |
| Spanje | 8,17 | 8,11 | 7,93 | 8,03 | 8,01 | 8,07 | 8,16 | 8,81 | 7,93 | 7,76 | 7,76 | 7,84 | 7,84 | 7,65 | 7,85 | 7,86 | 7,85 | 7,88 | 8,07 | 8,63 |
| Italië | 7,46 | 7,31 | 7,20 | 7,18 | 7,19 | 7,28 | 7,70 | 8,66 | 7,32 | 7,29 | 7,16 | 7,12 | 7,47 | 7,38 | 7,46 | 7,47 | 7,38 | 7,57 | 7,97 | 8,74 |
| Nederland | 8,86 | 8,95 | 8,75 | 8,65 | 8,61 | 8,63 | 8,63 | 8,80 | 8,48 | 8,58 | 8,50 | 8,59 | 8,58 | 8,71 | 8,68 | 8,62 | 8,68 | 8,71 | 8,61 | 8,82 |
| Polen | 5,90 | 6,03 | 6,02 | 6,05 | 6,09 | 6,07 | 6,20 | 6,25 | 6,01 | 5,91 | 5,84 | 5,88 | 5,98 | 6,47 | 6,63 | 6,71 | 6,60 | 6,65 | 6,91 | 6,86 |
| Frankrijk | 6,79 | 6,93 | 6,80 | 6,80 | 6,70 | 6,43 | 6,81 | 7,49 | 6,68 | 6,70 | 6,49 | 6,59 | 6,61 | 6,67 | 6,80 | 6,80 | 6,61 | 6,45 | 6,79 | 7,53 |
| Countries | jan 25 | feb 25 | mrt 25 | apr 25 | mei 25 | jun 25 | jul 25 | aug 25 | sep 25 | okt 25 | nov 25 | dec 25 | jan 26 | feb 26 | mrt 26 | apr 26 | mei 26 | jun 26 | jul 26 | aug 26 |
|---|---|---|---|---|---|---|---|---|---|---|---|---|---|---|---|---|---|---|---|---|
| Verenigd Koninkrijk | 12,9 | 13,0 | 13,3 | 12,8 | 13,2 | 13,4 | 12,9 | 11,8 | 13,5 | 12,9 | 13,3 | 12,7 | 12,4 | 12,5 | 12,8 | 12,5 | 12,7 | 12,9 | 12,4 | 11,3 |
| Duitsland | 12,5 | 12,6 | 13,2 | 13,3 | 13,2 | 13,2 | 13,0 | 12,3 | 13,4 | 13,6 | 13,8 | 13,2 | 12,9 | 13,0 | 13,2 | 13,1 | 13,3 | 13,4 | 12,9 | 12,6 |
| Spanje | 11,4 | 11,4 | 11,4 | 11,6 | 11,6 | 11,2 | 10,3 | 8,8 | 10,7 | 10,8 | 10,7 | 10,7 | 10,4 | 10,9 | 10,4 | 10,5 | 10,6 | 10,4 | 9,9 | 8,8 |
| Italië | 12,7 | 13,1 | 13,5 | 13,6 | 13,6 | 12,9 | 11,5 | 8,9 | 13,0 | 13,4 | 13,3 | 13,5 | 12,0 | 12,5 | 12,3 | 12,5 | 12,7 | 12,0 | 10,5 | 8,1 |
| Nederland | 9,4 | 9,4 | 9,7 | 9,6 | 9,7 | 9,6 | 9,7 | 9,1 | 10,0 | 9,6 | 9,8 | 9,5 | 9,3 | 9,2 | 9,4 | 9,4 | 9,2 | 9,3 | 9,3 | 8,8 |
| Polen | 14,1 | 13,9 | 14,1 | 14,0 | 13,6 | 13,5 | 12,9 | 12,6 | 13,2 | 13,5 | 13,3 | 13,5 | 12,9 | 12,4 | 12,2 | 11,8 | 12,3 | 12,2 | 11,2 | 11,4 |
| Frankrijk | 13,6 | 13,4 | 14,0 | 13,8 | 14,1 | 14,6 | 13,6 | 11,9 | 14,1 | 14,0 | 14,8 | 14,5 | 14,3 | 14,3 | 14,1 | 14,0 | 14,8 | 14,9 | 13,8 | 12,3 |
 South Africa
 Chile
 Colombia
 México
 United States
 Australia
 New Zealand
 United Arab Emirates
 Belgique (Français)
 Česká Republika
 Danmark
 Hungary
 Ireland
 Österreich
 Portugal
 Schweiz (Deutsch)
 Sverige